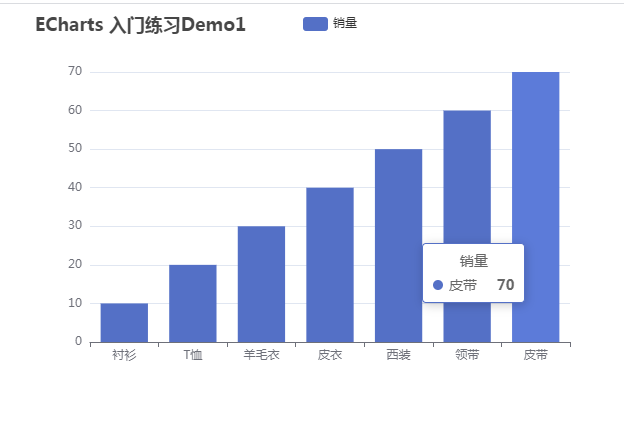
效果:
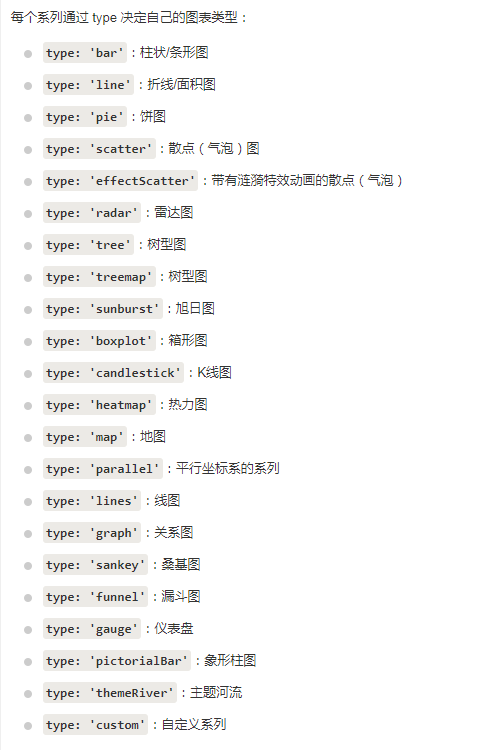
官网:https://echarts.apache.org/zh/index.html
前端web:
<%@ Page Language="C#" AutoEventWireup="true" CodeBehind="Demo_1.aspx.cs" Inherits="WebApplication1.Demo_1" %>

<!DOCTYPE html>

<html xmlns="http://www.w3.org/1999/xhtml">
<head runat="server">
    <meta http-equiv="Content-Type" content="text/html; charset=utf-8" />
    <title>Demo1</title>
    <script src="js/echarts.js"></script>
    <script src="js/jquery-3.5.1.min.js"></script>
    <script>
        var ds = new Array();
        var dsdate = new Array();
        var myChart;

        //Ajax请求
        var getArrayByAjax = function () {
            var cnt = 0;
            $.ajax({
                url: "Demo_1.aspx/GetArray",
                type: "post",
                contentType: "application/json; charset=utf-8",
                success: function (data) {
                    cnt = (data.d).length;
                    for (var i = 0; i < (data.d).length; i++) {
                        ds.push((data.d)[i]["name"]);
                        dsdate.push((data.d)[i]["count"]);
                    }

                    // 指定图表的配置项和数据
                    var option = {
                        title: {
                            text: 'ECharts 入门练习Demo1'
                        },
                        tooltip: {},
                        legend: {
                            data: ['销量']
                        },
                        xAxis: {
                            data: ds
                        },
                        yAxis: {},
                        series: [{
                            name: '销量',
                            type: 'bar',
                            data: dsdate
                        }]
                    };
                    myChart.hideLoading();  // 隐藏 loading 效果

                    // 使用刚指定的配置项和数据显示图表。
                    myChart.setOption(option);

                },
                error: function (err) {
                    alert("error");
                }
            });
        }
        $(function () {
            // 基于准备好的dom,初始化echarts实例
            myChart = echarts.init(document.getElementById('main'));
            myChart.showLoading();  // 开启 loading 效果

            getArrayByAjax();

        });

    </script>
</head>
<body>
    <form id="form1" runat="server">
        <div style="margin: 0 auto; text-align: center; 650px; height:450px;">
            <div id="main" style=" 600px; height: 400px;"></div>
        </div>
    </form>
</body>
</html>
cs后台:
using System;
using System.Collections;
using System.Collections.Generic;
using System.Linq;
using System.Web;
using System.Web.Services;
using System.Web.UI;
using System.Web.UI.WebControls;

namespace WebApplication1
{
    public partial class Demo_1 : System.Web.UI.Page
    {
        protected void Page_Load(object sender, EventArgs e)
        {

        }

        [WebMethod]
        public static List<Demo1> GetArray()
        {

            List<Demo1> arrList = new List<Demo1>();
            arrList.Add(new Demo1 { name = "衬衫",count = 10 });
            arrList.Add(new Demo1 { name = "T恤", count = 20 });
            arrList.Add(new Demo1 { name = "羊毛衣", count = 30 });
            arrList.Add(new Demo1 { name = "皮衣", count = 40 });
            arrList.Add(new Demo1 { name = "西装", count = 50 });
            arrList.Add(new Demo1 { name = "领带", count = 60 });
            arrList.Add(new Demo1 { name = "皮带", count = 70 });
            return arrList;
        }

    }

    public class Demo1 {
        public string name { get; set; }
        public int count { get; set; }
    }

}
参考:https://www.runoob.com/echarts/echarts-setup.html